<- seq(-2, 6, length.out = 1000)
x <- function(x) I(0 <= x & x <= 2) - (x - 1) * I(1 <= x & x <= 2)
b1 <- function(x) (x - 3) * I(3 <= x & x <= 4) + I(4 < x & x <= 5)
b2 <- function(x) 1 + 1 * b1(x) + 3 * b2(x)
f plot(x, f(x), type = "l", lwd=2)
grid()
Lab 7: Moving Beyond Linearity
Questions
Conceptual Questions
\star Solution (ISLR2, Q7.2) Suppose that a curve \hat{g} is computed to smoothly fit a set of n points using the following formula: \hat{g} = \arg \min_g\left ( \sum_i^n \bigl(y_i - g(x_i)\bigr)^2 + \lambda\int \bigl[ g^{(m)}(x) \bigr]^2 \mathrm{d}x \right ), where g^{(m)} represents the mth derivative of g (and g^{(0)} = g). Provide example sketches of \hat{g} in each of the following scenarios.
\lambda = \infty, m = 0.
\lambda = \infty, m = 1.
\lambda = \infty, m = 2.
\lambda = \infty, m = 3.
\lambda = 0, m = 3.
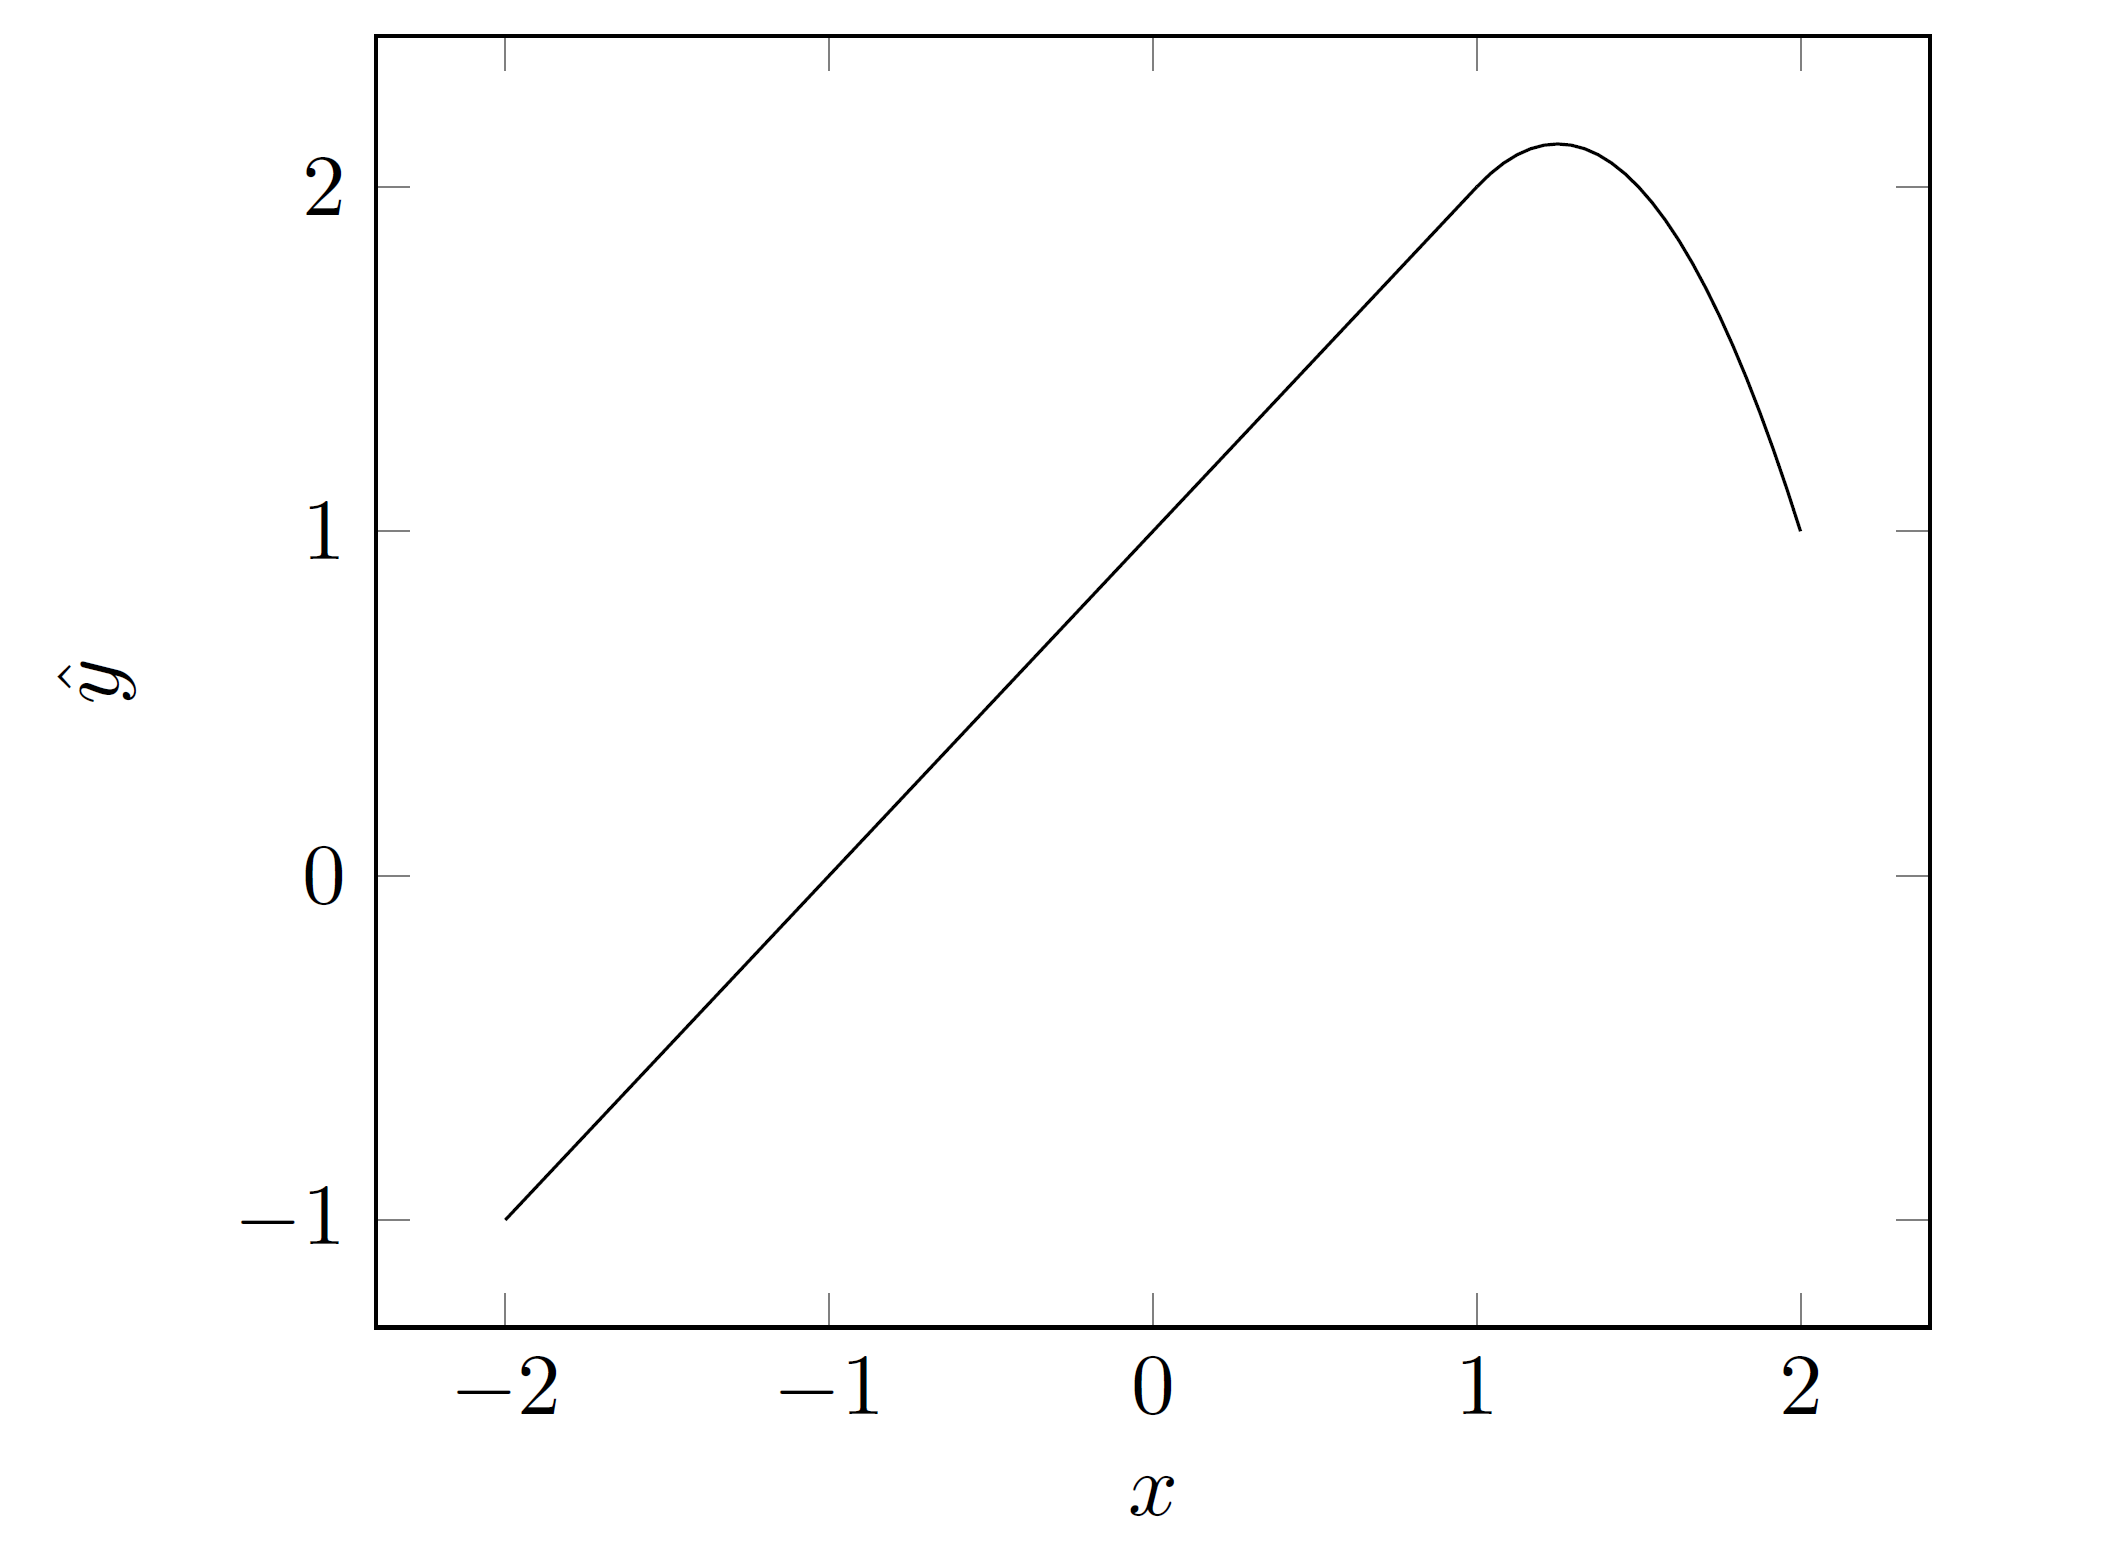
\star Solution (ISLR2, Q7.3) Suppose we fit a curve with basis functions b_1(X) = X, b_2(X) = (X-1)^2I(X \geq 1). (Note that I(X \geq 1) equals 1 for X \geq 1 and 0 otherwise.) We fit the linear regression model Y = \beta_0 + \beta_1 b_1(X) + \beta_2 b_2(X) + \epsilon, and obtain coefficient estimates \hat{\beta_0} = 1, \hat{\beta}_1 = 1, \hat{\beta_2} = -2. Sketch the estimated curve between X = -2 and X = 2. Note the intercepts, slopes, and other relevant information.
Solution (ISLR2, Q7.4) Suppose we fit a curve with basis functions b_1(X) = I(0 \leq X \leq 2) - (X-1)I(1 \leq X \leq 2), b_2(X) = (X-3)I(3 \leq X \leq 4)+I(4 < X \leq 5). We fit the linear regression model Y = \beta_0 + \beta_1 b_1(X) + \beta_2 b_2(X) + \epsilon, and obtain coefficient estimates \hat{\beta_0} = 1, \hat{\beta}_1 = 1, \hat{\beta_2} = 3 . Sketch the estimated curve between X = -2 and X = 6. Note the intercepts, slopes, and other relevant information.
\star Solution (ISLR2, Q7.5) Consider two curves, \hat{g}_1 and \hat{g}_2, defined by \hat{g}_1 = \arg \min_g\left ( \sum_i^n (y_i - g(x_i))^2 + \lambda\int \left [ g^{(3)}(x) \right ]^2 \mathrm{d}x \right ), \hat{g}_2 = \arg \min_g\left ( \sum_i^n (y_i - g(x_i))^2 + \lambda\int \left [ g^{(4)}(x) \right ]^2 \mathrm{d}x \right ), where g^{(m)} represents the mth derivative of g.
As \lambda \rightarrow \infty, will \hat{g}_1 or \hat{g}_2 have the smaller training RSS?
As \lambda \rightarrow \infty will \hat{g}_1 or \hat{g}_2 have the smaller test RSS?
For \lambda = 0, will \hat{g}_1 or \hat{g}_2 have the smaller training and test RSS?
Applied Questions
Solution (ISLR2, Q7.6) In this exercise, you will further analyze the
Wage
data set considered throughout this chapter.Perform polynomial regression to predict
wage
usingage
. Use cross-validation to select the optimal degree d for the polynomial. What degree was chosen, and how does this compare to the results of hypothesis testing using ANOVA? Make a plot of the resulting polynomial fit to the data.Fit a step function to predict
wage
usingage
, and perform cross validation to choose the optimal number of cuts. Make a plot of the fit obtained.
\star Solution (ISLR2, Q7.9) This question uses the variables
dis
(the weighted mean of distances to five Boston employment centers) andnox
(nitrogen oxides concentration in parts per 10 million) from theBoston
data. We will treatdis
as the predictor andnox
as the response.Use the
poly()
function to fit a cubic polynomial regression to predict nox usingdis
. Report the regression output, and plot the resulting data and polynomial fits.Plot the polynomial fits for a range of different polynomial degrees (say, from 1 to 10), and report the associated residual sum of squares.
Perform cross-validation or another approach to select the optimal degree for the polynomial, and explain your results.
Use the
bs()
function to fit a regression spline to predict nox using dis. Report the output for the fit using four degrees of freedom. How did you choose the knots? Plot the resulting fit.Now fit a regression spline for a range of degrees of freedom, and plot the resulting fits and report the resulting RSS. Describe the results obtained.
Perform cross-validation or another approach in order to select the best degrees of freedom for a regression spline on this data. Describe your results.
Solutions
Conceptual Questions
-
Since \lambda \to \infty, any non-zero value of \int (g^{(m)}(x))^2 \mathrm{d}x will lead to an infinite penalty. Hence, it must integrate to zero, which can only occur if g^{(m)}(x) = 0. For m=0, this will occur if g(x) = 0.
The optimisation will find the best curve that fits the data provided g^{(m)}(x) = 0. So, if m=1, we need the first derivative of g(x) to be 0, which means g(x)=k (k some constant). Note the constant k that minimises the sum of squares is the mean of the y_is, k=\bar{y}.
Now, the seconde derivative of g(x) needs to be 0 (the first derivative can be a constant). This means g(x) is the straight line of best fit for the data (i.e., the best line from simple linear regression).
Now, g(x) needs to have a “constant rate of change”, i.e., the second derivative is a constant (so third derivative is 0). This is achieved by a quadratic (parabola) curve of best fit for the data.
Since \lambda=0, the smoothness penalty is ignored. Hence g will be a polynomial that goes through all the data points (overfitting much).
Question The sketch should look like:
Solution Question Credit goes to Daniel Halligan for this solution:
-
The function \hat{g}_2 will lead to a more flexible fit, and hence should should have the better training RSS. Indeed, only its fourth derivative is constrained, which means that a cubic polynomial of best fit for the data is permitted (while \hat{g}_1 corresponds to a quadratic
curve of best fit for the data).We can’t say for sure. Some conventional wisdom might suggest \hat{g}_1, since it is not as likely to overfit the data. However, \hat{g}_2 may outperform it if the underlying trend is more cubic than quadratic.
If \lambda = 0, then both optimisations are doing the same thing, so neither one is better or worse than the other (note both will be as flexible as needed to “perfectly” fit the training data and RSS will be 0).
Applied Questions
-
library(ISLR2) library(boot) <- glm(wage ~ age, data = Wage) fit1 # try using an iterative (and somewhat naive) ANOVA method <- 1 degree while (tail(summary(fit1)$coefficients[, 4], 1) < 0.05) { <- degree + 1 degree <- glm(wage ~ poly(age, degree), data = Wage) fit1 } degree
[1] 4
According to this method, the best fit is when we use degree 4. Let us try CV as the question suggests.
set.seed(1) <- 12 highest.order <- c() cv.error for (i in 1:highest.order) { <- glm(wage ~ poly(age, i), data = Wage) fit1 <- cv.glm(Wage, fit1, K=10)$delta[1] cv.error[i] }plot(1:highest.order, cv.error, type = "l", col="brown3", lwd=2, xlab="polynomial order")
which.min(cv.error)
[1] 9
While technically the lowest cross-validated MSE is obtained for a polynomial of order 9, it looks like an order 4 has already achieved most of the possible reduction.
<- lm(wage ~ poly(age, 3), data = Wage) fit3 <- lm(wage ~ poly(age, 4), data = Wage) fit4 <- lm(wage ~ poly(age, 5), data = Wage) fit5 <- data.frame(age = seq(from = 18, to = 80, length.out = 100)) age.grid <- predict(fit3, age.grid) pred3 <- predict(fit4, age.grid) pred4 <- predict(fit5, age.grid) pred5
library(ISLR2) plot(Wage$age, Wage$wage, col = "grey") lines(age.grid$age, pred3, col = "blue") lines(age.grid$age, pred4, col = "red") lines(age.grid$age, pred5, col = "green")
The fitted curves are quite close to each other.
set.seed(1) <- c() cv.error <- 12 cut.nbr for (i in 2:cut.nbr) { $age.fact <- cut(Wage$age, i) #create categorical predictor for age Wage<- glm(wage ~ age.fact, data = Wage) fit - 1] <- cv.glm(Wage, fit, K = 10)$delta[1] cv.error[i }plot(2:cut.nbr, cv.error, type = "l", col="brown3", lwd=2, xlab="number of cut")
which.min(cv.error) # this returns the index of the smallest element
[1] 7
It seems like 8 cut-points is appropriate here.
<- glm(wage ~ cut(age, 8), data = Wage) fit <- 18:80 my.ages <- predict(fit, data.frame(age=my.ages)) fitted plot(Wage$age, Wage$wage, col = "grey") points(my.ages, fitted, type="l", lwd=2, col = "blue")
-
library(ISLR2) <- lm(nox ~ poly(dis, 3), data = Boston) fit <- seq(min(Boston$dis), max(Boston$dis), length.out = 100) dis.grid <- predict(fit, newdata = list(dis = dis.grid)) pred plot(Boston$dis, Boston$nox, xlab = "dis", ylab = "nox") lines(dis.grid, pred, lwd=2, col="brown3")
summary(fit)
Call: lm(formula = nox ~ poly(dis, 3), data = Boston) Residuals: Min 1Q Median 3Q Max -0.121130 -0.040619 -0.009738 0.023385 0.194904 Coefficients: Estimate Std. Error t value Pr(>|t|) (Intercept) 0.554695 0.002759 201.021 < 2e-16 *** poly(dis, 3)1 -2.003096 0.062071 -32.271 < 2e-16 *** poly(dis, 3)2 0.856330 0.062071 13.796 < 2e-16 *** poly(dis, 3)3 -0.318049 0.062071 -5.124 4.27e-07 *** --- Signif. codes: 0 '***' 0.001 '**' 0.01 '*' 0.05 '.' 0.1 ' ' 1 Residual standard error: 0.06207 on 502 degrees of freedom Multiple R-squared: 0.7148, Adjusted R-squared: 0.7131 F-statistic: 419.3 on 3 and 502 DF, p-value: < 2.2e-16
<- c() rss <- c( colours "orange", "red", "lightblue", "green", "brown", "purple", "pink", "lightgoldenrod", "violet", "magenta", "darkblue" )plot(Boston$dis, Boston$nox, xlab = "dis", ylab = "nox", ylim=c(0.3, 0.9)) for (i in 1:10) { <- lm(nox ~ poly(dis, i, raw = TRUE), data = Boston) fit <- sum(fit$residuals^2) rss[i] <- predict(fit, newdata = data.frame(dis = dis.grid)) pred lines(dis.grid, pred, col = colours[i]) }
print(rss)
[1] 2.768563 2.035262 1.934107 1.932981 1.915290 1.878257 1.849484 1.835630 [9] 1.833331 1.832171
set.seed(1) <- c() cv.error for (i in 1:10) { <- glm(nox ~ poly(dis, i), data = Boston) fit <- cv.glm(Boston, fit)$delta[1] cv.error[i] }plot(1:10, cv.error, type = "l", col="brown3", lwd=2)
print(cv.error)
[1] 0.005523868 0.004079449 0.003874762 0.003887521 0.004164865 0.005384278 [7] 0.011068782 0.008121397 0.017616356 0.004430276
which.min(cv.error)
[1] 3
We obtain that degree 3 is best. Note that by not specifying the argument
K
in functioncv.glm
, the default is thatK
is equal to the sample size. Said otherwise, LOOCV is performed (which is why the code takes some time to run… it is a “computationally expensive” method). But note we get similar results with the standard K=5 or K=10.library(splines) # Picking arbitrary knots <- lm(nox ~ bs(dis, knots=c(3,6), df = 4), data = Boston) fit <- predict(fit, newdata = data.frame(dis = dis.grid)) pred plot(Boston$dis, Boston$nox, col = "gray") lines(dis.grid, pred, lwd = 2, col="brown3")
# Let R pick knots <- lm(nox ~ bs(dis, df = 4), data = Boston) fit <- predict(fit, newdata = data.frame(dis = dis.grid)) pred plot(Boston$dis, Boston$nox, col = "gray") lines(dis.grid, pred, lwd = 2, col="brown3")
# Recover the knots attr(bs(Boston$dis , df = 4), "knots")
[1] 3.20745
# Realise this is just the median (since there is only one knot) median(Boston$dis)
[1] 3.20745
If we don’t pick the knots,
R
just picks uniform quantiles of the data (e.g., for 3 knots it would be the 25%, 50% and 75% quantiles.)<- c() rss plot(Boston$dis, Boston$nox, col = "gray",ylim=c(0.35, 0.9)) for (i in 3:7) { <- lm(nox ~ bs(dis, df = i), data = Boston) fit - 2] <- sum(fit$residuals^2) rss[i <- predict(fit, newdata = data.frame(dis = dis.grid)) pred lines(dis.grid, pred, col = colours[i]) }
plot(Boston$dis, Boston$nox, col = "gray",ylim=c(0.35, 0.9)) for (i in 8:11) { <- lm(nox ~ bs(dis, df = i), data = Boston) fit - 2] <- sum(fit$residuals^2) rss[i <- predict(fit, newdata = data.frame(dis = dis.grid)) pred lines(dis.grid, pred, col = colours[i]) }
print(rss)
[1] 1.934107 1.922775 1.840173 1.833966 1.829884 1.816995 1.825653 1.792535 [9] 1.796992
For larger “degrees of freedom”, some overfitting occurs (fitted lines are more wobbly).
set.seed(1) <- c() cv.error options(warn=-1) # we remove warnings (yes, living dangerously) for (i in 3:11) { <- glm(nox ~ bs(dis, df = i), data = Boston) fit - 2] <- cv.glm(Boston, fit, K = 10)$delta[1] cv.error[i }options(warn=0) # reset to default plot(3:11, cv.error, type = "l", xlab = "df", lwd=2, col="brown3")
which.min(cv.error)
[1] 4
We would select 6 degrees of freedom (the smallest CV is obtained for the fourth element of vector
cv.error
, but note the first element corresponds to 3 degrees of freedom).